Profiler
 The Application Profiler is a performance analysis tool that can determine where the elapsed time is spent for a program running on a ClearPath system. The tool can collect this information without any changes to the program. The Application Profiler is able to determine which statements and procedures are used most heavily including any activities that occur in libraries, DMSII, COMS or the MCP.
Architecture
The Application Profiler package consists of four main components.
- A sampler program that collects data about a program running on the system.
- An analyzer program that post-processes the data from the sampler program to create data files for further analysis on a PC.
- Three Microsoft Access databases that hold data from one or more sampling sessions.
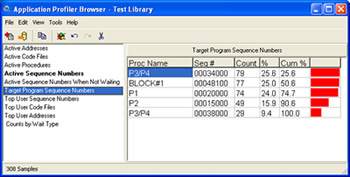
- A Windows-based browser program that is used to view the analyzed data.
Profiling a Program
To profile a program, you run the sampler program on the ClearPath system, giving the mix number of the program to be sampled. Next you run the analyzer program on the same system you ran the sampler. The analyzer locates the code files used by the program to determine procedure names and sequence numbers for its analysis. The results of the analysis are stored in files that can be loaded by the Windows browser program.
On a PC, the browser program is run to import the ClearPath data into the Access databases. Finally, the browser program is used to do queries against the databases to show the results of the analysis.
Displaying the Results
You can see where the program is spending its time in many different ways. You can look at the sampling statistics in the following ways:
 Active address
- Active code files
- Active sequence numbers
- Active sequence numbers when not waiting
- Target program sequence numbers
- Top user sequence number
- Top user code files
- Top user address
- Counts by wait time